import numpy as np
import pandas as pd
import matplotlib.pyplot as plt

N = 10
np.random.seed(8)
df = pd.DataFrame({
    'A': np. random.randint(10, size=N),
    'B': np. random.randint(10, size=N),
    'C': np. random.randint(10, size=N)
}, index=pd.date_range('2020-09-01', periods=N))
df
| A | B | C | |
|---|---|---|---|
| 2020-09-01 | 3 | 1 | 5 |
| 2020-09-02 | 4 | 3 | 5 |
| 2020-09-03 | 1 | 9 | 7 |
| 2020-09-04 | 9 | 2 | 9 |
| 2020-09-05 | 5 | 2 | 2 |
| 2020-09-06 | 8 | 6 | 6 |
| 2020-09-07 | 3 | 8 | 9 |
| 2020-09-08 | 8 | 9 | 5 |
| 2020-09-09 | 0 | 3 | 1 |
| 2020-09-10 | 5 | 4 | 6 |
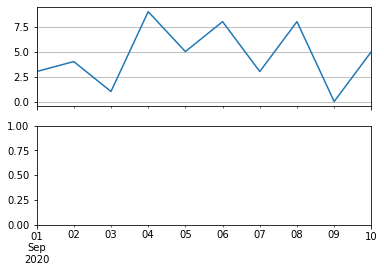
そこで、次のようなコードを実行すると、2段のグラフの内、上のグラフが描画されなかった。
fig, ax = plt.subplots(2, 1, sharex=True)
df['A'].plot(ax=ax[0], grid=True)
df[['B', 'C']].plot(kind='bar', ax=ax[1], grid=True)
plt.show()

下のグラフを描画しなければ、上のグラフが描画される。
fig, ax = plt.subplots(2, 1, sharex=True)
df['A'].plot(ax=ax[0], grid=True)
plt.show()

原因は、次のコードを実行するとわかった。
fig, ax = plt.subplots(2, 1, sharex=True)
df['A'].plot(ax=ax[0], grid=True)
print("xlim after 1st plot:", ax[0].get_xlim())
df[['B', 'C']].plot(kind='bar', ax=ax[1], grid=True)
print("xlim after 2nd plot:", ax[0].get_xlim())
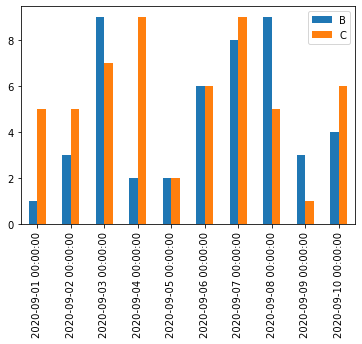
つまり、 pandas.DataFrame.plot は kind='line' と kind='bar' とで描画した後のX座標の範囲(xlim)が全く異なり、xlim after 1st plot: (18506.0, 18515.0) xlim after 2nd plot: (-0.5, 9.5)
matplotlib.pyplot.subplots(sharex=True) した状態でこの2つを描画すると、先に描画した座標系(Axes)のxlimが書き換えられてしまうのが原因である。色々調べまくったが、棒グラフ表示にこだわると、pandas.DataFrame.plotを使って解決する方法は見つからなかった。(kind='scatter'の点グラフなら同じ問題が起こらないことを確認した。コードは省略)
Seabornを使っても、結果は同じだった。
import seaborn as sns
fig, ax = plt.subplots(2, 1, sharex=True)
df['A'].plot(ax=ax[0], grid=True)
print("xlim after 1st plot:", ax[0].get_xlim())
_ = df[['B', 'C']].melt(ignore_index=False).reset_index()
sns.barplot(x='index', y='value', hue='variable', data=_)
print("xlim after 2nd plot:", ax[0].get_xlim())
plt.show()
xlim after 1st plot: (18506.0, 18515.0)
xlim after 2nd plot: (-0.5, 9.5)

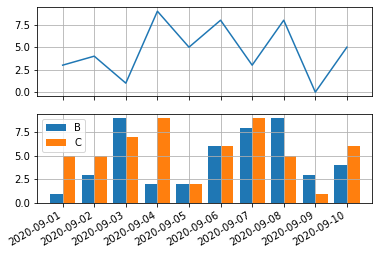
結局、棒グラフだけ直接matplotlib APIを使って描画すると解決した。
fig, ax = plt.subplots(2, 1, sharex=True)
df['A'].plot(ax=ax[0], grid=True)

width = pd.Timedelta('0.4d')
ax[1].bar(df.index - width/2, df['B'], width=width, label='B')
ax[1].bar(df.index + width/2, df['C'], width=width, label='C')
ax[1].set_xlim(df.index[0] - width*2, df.index[-1] + width*2)
ax[1].grid(True)
ax[1].legend()

fig.autofmt_xdate()
plt.show()

上述の原因からすると、1つのグラフに pandas.DataFrame.plot で折れ線グラフと棒グラフを重ねて描こうとしても同じ問題が起こることがわかる。
fig = plt.figure()
ax = fig.gca()
df['A'].plot(ax=ax, grid=True)
print("xlim after 1st plot:", ax.get_xlim())
df[['B', 'C']].plot(kind='bar', ax=ax)
print("xlim after 2nd plot:", ax.get_xlim())
plt.show()
(18506.0, 18515.0)
(-0.5, 9.5)

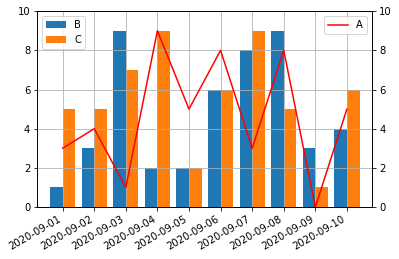
これも同じく、棒グラフをmatplotlib APIで描画すると解決する。
fig = plt.figure()
ax1 = fig.gca()
ax2 = ax1.twinx()

df['A'].plot(ax=ax2, color='r')  # 折れ線グラフが上になるようにする為にax2を指定

width = pd.Timedelta('0.4d')
ax1.bar(df.index - width/2, df['B'], width=width, label='B')
ax1.bar(df.index + width/2, df['C'], width=width, label='C')

ax1.set_xlim(df.index[0] - width*2, df.index[-1] + width*2)
ax1.set_ylim(0, 10)
ax2.set_ylim(0, 10)
ax1.grid()

ax1.legend(loc='upper left')
ax2.legend(loc='upper right')

fig.autofmt_xdate()
plt.show()

この例では縦軸のスケールが同じなので、上のコードのようにtwinxを使わなくても良いように思うが、twinxを使わないと何故か、ax1.barの引数のwidth指定が効かなかった。折れ線グラフと棒グラフとを重ねたい時にtwinxを使わなくて良いケースは少ないと思うので、原因は追究しないことにした。
X軸の値が勝手に変えられるということは、pandas.DataFrame.plot.barはX軸がカテゴリー変数であるという前提があり、時系列データを棒グラフで表示することを考慮していないように思う。偶発的に起こる事象のカウントなど、ある時刻の値が過去の値に依存しないような時系列データは棒グラフで示したいこともあると思うし、折れ線グラフが何をトリガーにして上下するのかを見たい時に時間軸を揃えて棒グラフを描画したいこともあると思うのだが、そう思うのがナンセンスなのだろうか。
コメント